22
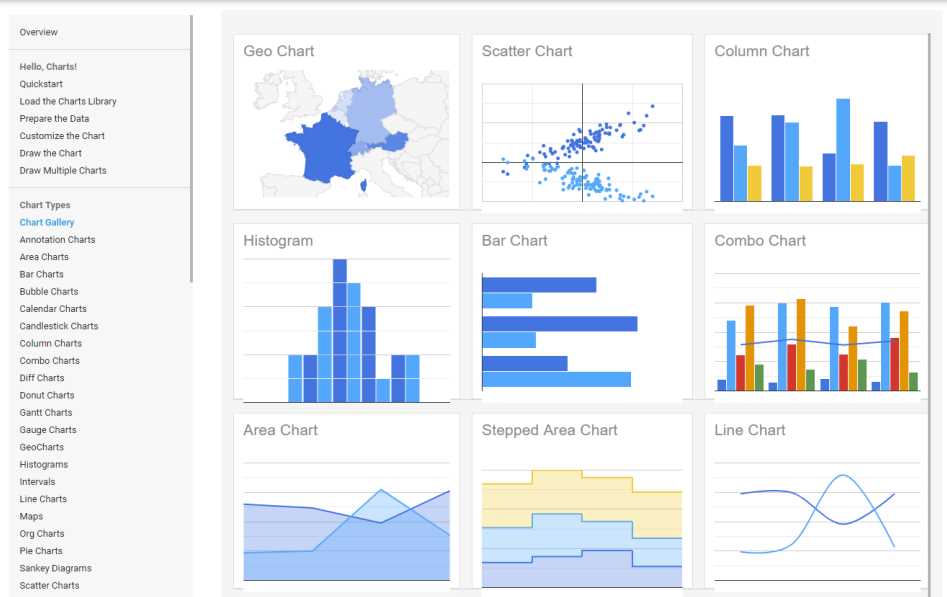
Google图表是一种非常简单的工具,可让您轻松地根据一些数据创建图表并将其嵌入网页中。您将数据和格式参数嵌入到HTTP请求中,然后Google返回图表的PNG图像。支持多种类型的图表,通过将请求放入图像标签中,您可以简单地将图表包括在网页中。
分类目录
Web版Google Charts的替代品
2
2
Zoho Analytics
创建具有洞察力的报告和仪表盘,以可视方式分析您的业务信息。使用拖放界面轻松创建具有洞察力的报告和仪表盘。无需IT帮助。
1
Charts 4 PHP
用于PHP的数据库驱动的图表和量规—用于Web和移动的HTML5可视化。折线图,多折线面积图,条形图,饼图/甜甜圈图,仪表规,漏斗图等等。响应式,交互式,动画,易于使用!
- 免费的个人应用
- Web
0