0
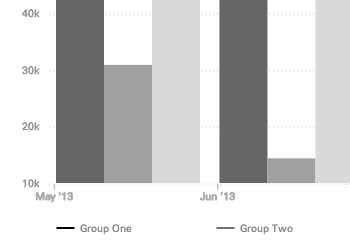
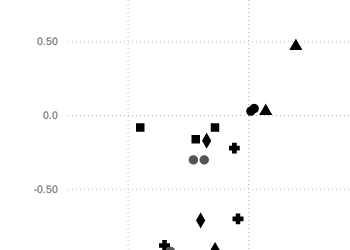
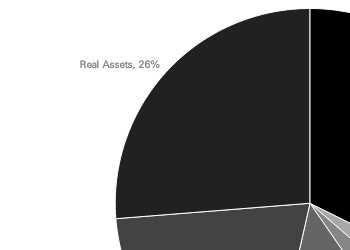
Ember Charts是使用Ember.js和d3.js框架构建的图表库。它包括时间序列图,条形图,饼图和散点图,它们易于扩展和修改。这些图表组件具有开箱即用的行为,代表了我们对图表交互性和表示形式最佳实践的看法。
特征
分类目录
Android版Ember Charts的替代品
17
15
Webix UI
适用于开发人员的JavaScript库/ HTML5 UI框架,带有SpreadSheet,Pivot,看板,FileManager,Scheduler,Datatable,TreeTable等小部件。