4
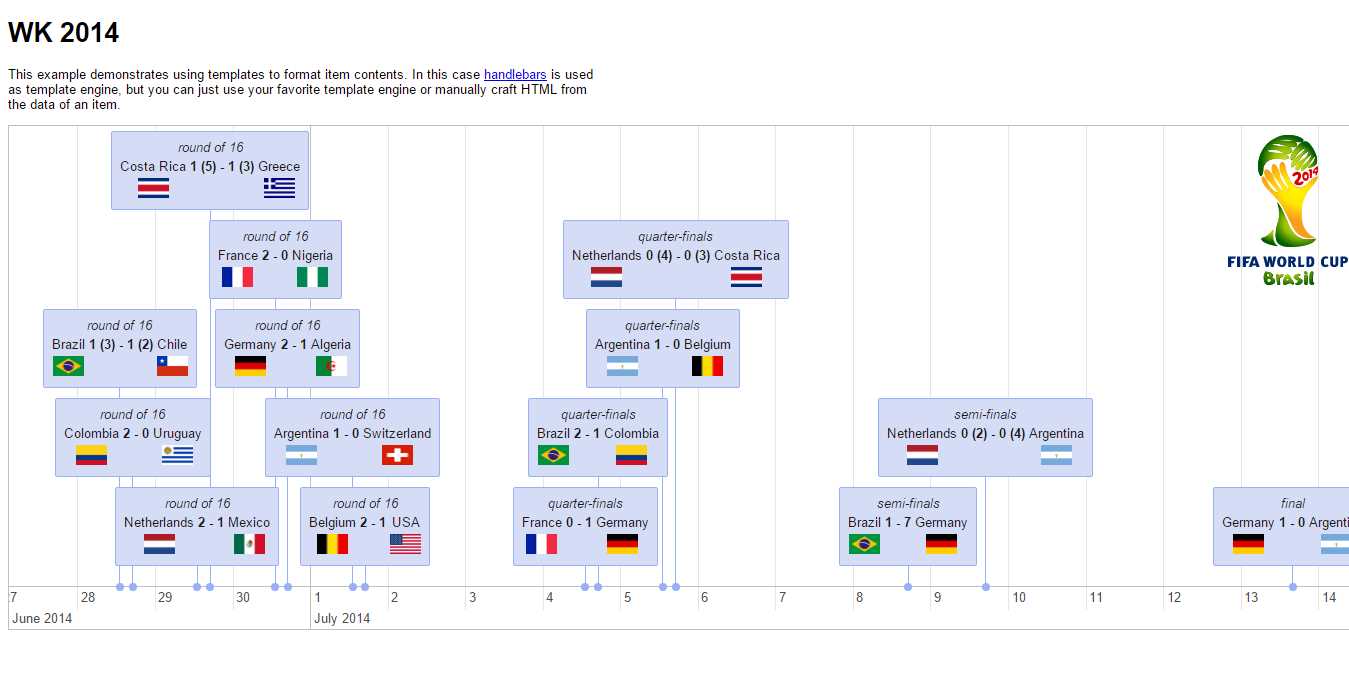
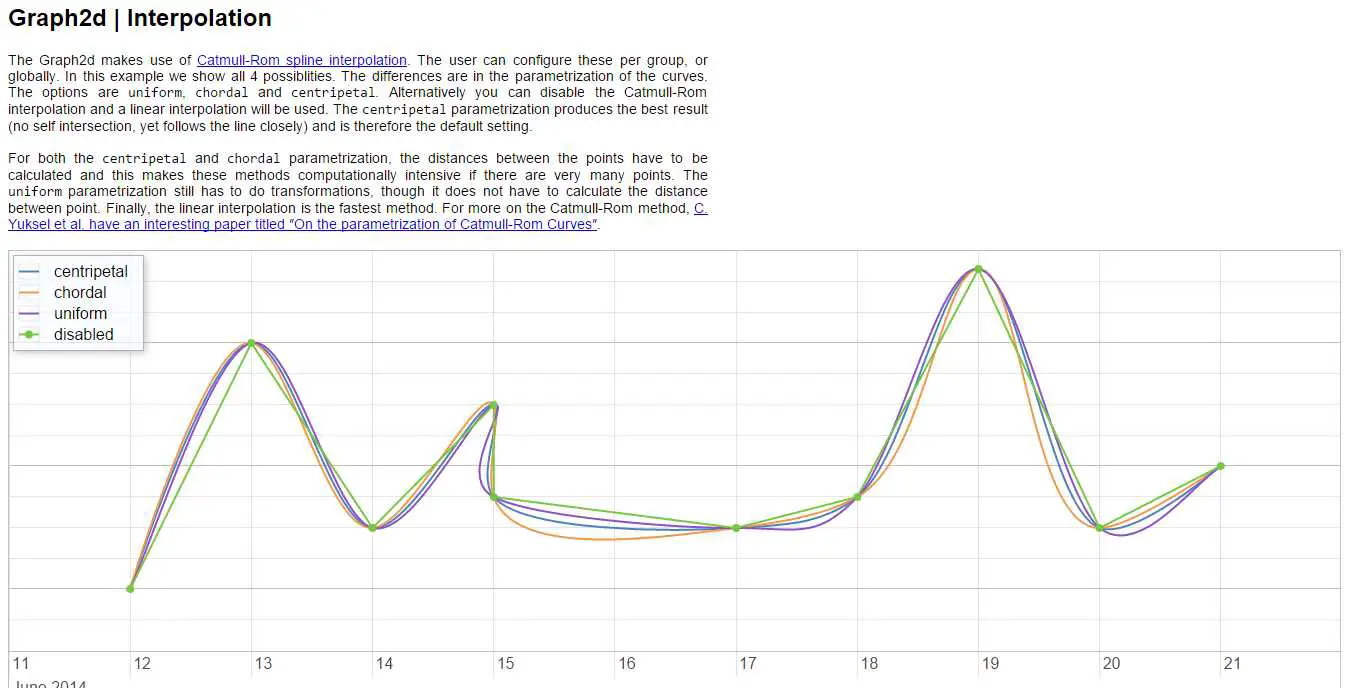
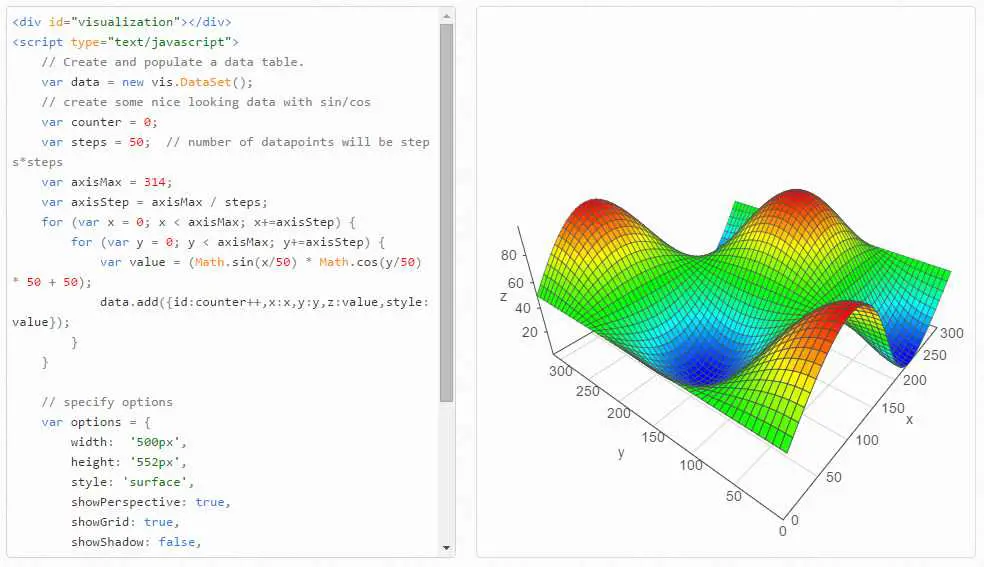
vis.js是一个动态的,基于浏览器的可视化库。该库的设计易于使用,处理大量动态数据,并能够操纵数据并与之交互。该库由数据集,时间轴,网络,Graph2d和Graph3d组成。
特征
分类目录
具有任何许可的所有平台的Vis.js替代品
72
33
CanvasJS Charts
CanvasJS是易于使用的HTML5和Javascript Charting库。它可在包括iPhone,iPad,Android,Windows Phone,Microsoft Surface,台式机等的设备上运行。
- 免费的个人应用
- Web
29
RAWGraphs
RAWGraphs是一个开源应用程序,旨在让每个人都可以轻松查看复杂数据。RAWGraphs作为设计人员和视觉爱好者的工具而生,旨在提供电子表格和矢量图形编辑器之间缺少的链接。
- 免费应用
- Web
- Self-Hosted
26
22
21
21
17
17
Highcharts
Highcharts是一个用纯JavaScript编写的图表库,它提供了一种将交互式图表添加到您的网站或Web应用程序的简便方法。
- 免费的个人应用
- Web
- Self-Hosted
- Java Mobile
15
Webix UI
适用于开发人员的JavaScript库/ HTML5 UI框架,带有SpreadSheet,Pivot,看板,FileManager,Scheduler,Datatable,TreeTable等小部件。
14
FusionCharts Suite XT
FusionCharts Suite XT可帮助您轻松地为所有Web,移动和企业应用程序创建交互式JavaScript图表,量表和地图。
11
ChartURL
Google Image Charts的替代方案,使开发人员和营销人员可以在他们的电子邮件,Slackbots,Web /移动应用程序等中嵌入个性化图表。
- 免费增值应用
- Web
- Self-Hosted