0
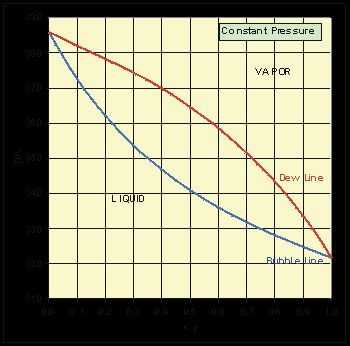
格雷厄姆·格里夫(Grahame Grieve)着。TxyGraph是一个Delphi组件,用于绘制,曲线拟合和打印y vs x数据的图形。每个TxyGraph代表一个带有X和2个Y轴的绘图区域。要绘制的数据包含在序列中。只能在运行时添加数据。每个TxyGraph可以具有无限数量的系列。序列中的点数没有限制。可以使用几种回归/曲线拟合方法对数据进行统计分析。
分类目录
Web版Txygraph的替代品
3
2
1
Charts 4 PHP
用于PHP的数据库驱动的图表和量规—用于Web和移动的HTML5可视化。折线图,多折线面积图,条形图,饼图/甜甜圈图,仪表规,漏斗图等等。响应式,交互式,动画,易于使用!
- 免费的个人应用
- Web
0
