0
SigmaPlot
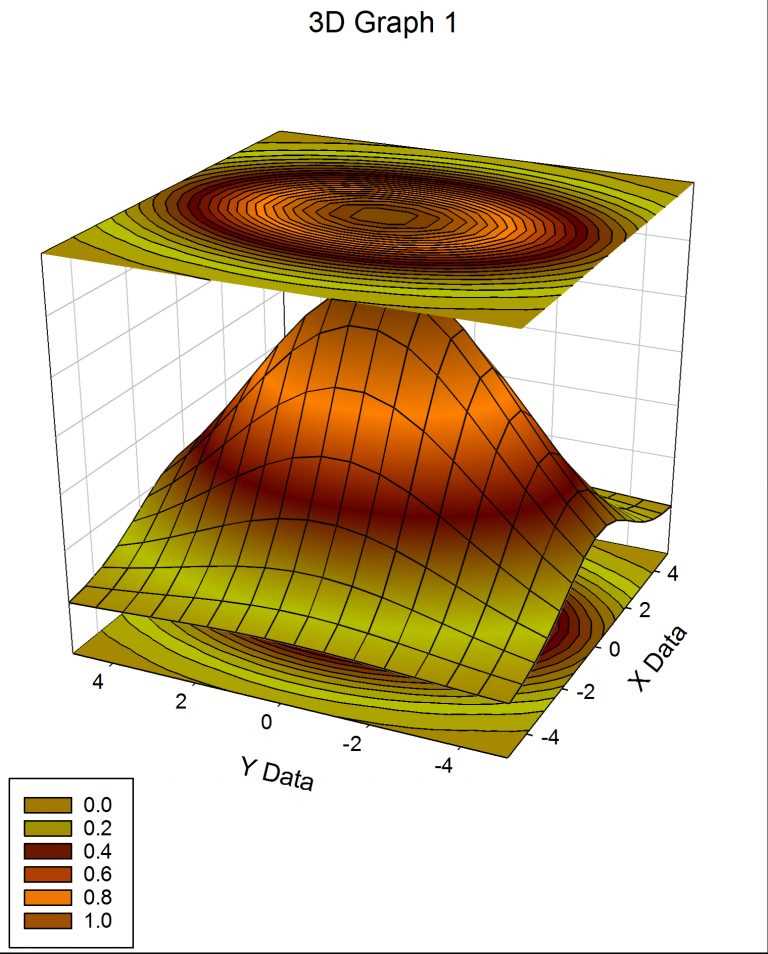
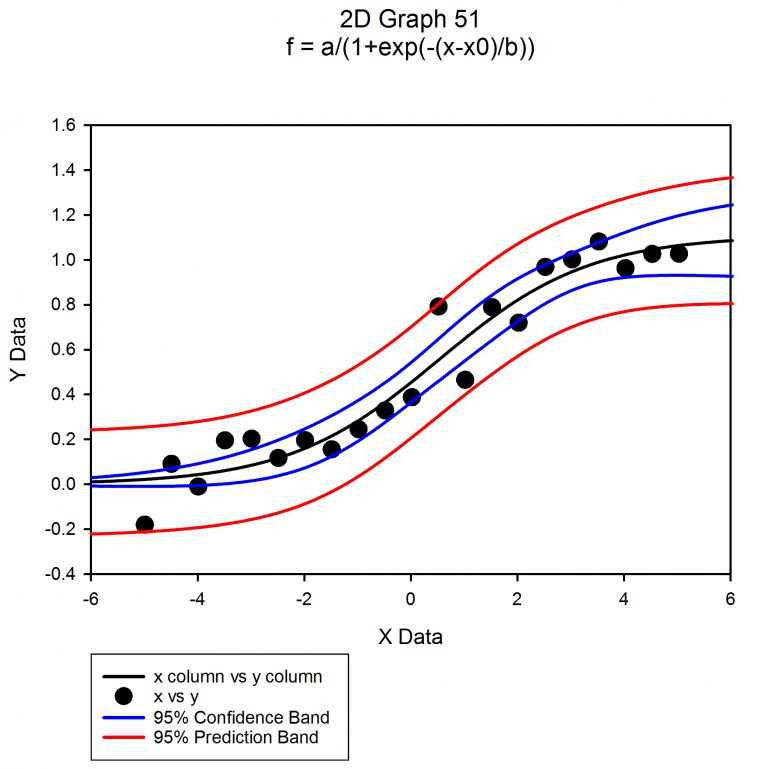
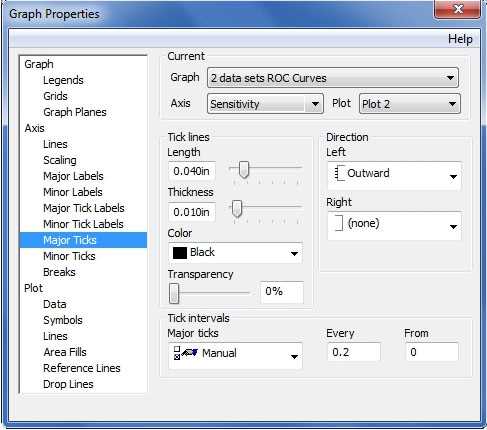
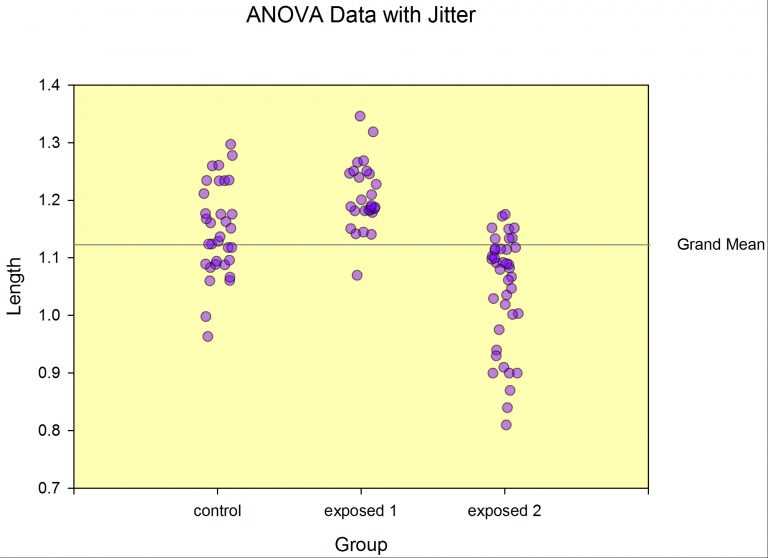
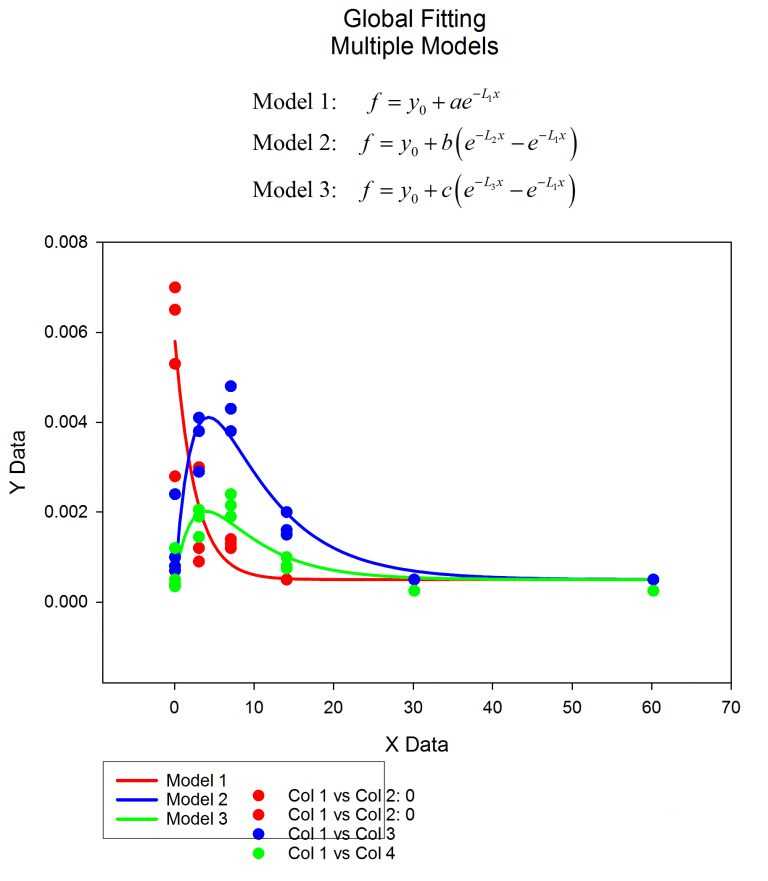
SigmaPlot is a proprietary software package for scientific graphing and data analysis for Microsoft Windows.The software can read multiple formats and perform mathematical transforms and statistical analyses.
SigmaPlot是一个科学的数据分析和制图软件包,具有直观的界面,可满足您所有的统计分析和制图需求,使您不仅可以使用简单的电子表格,还可以在不花费大量时间在计算机前的情况下生成高质量的图。
分类目录

Mac版SigmaPlot的替代品
9
Mirai Math
GNU Octave的图形前端。编辑公式的固有数学符号。适用于Linux x586 / x86_64,WinXP,Vista和MacOS。
2
0
GraphPad Prism
Prism is an analysis and graphing solution purpose-built for scientific research.