GraphPad Prism

GraphPad Prism

Prism is an analysis and graphing solution purpose-built for scientific research.
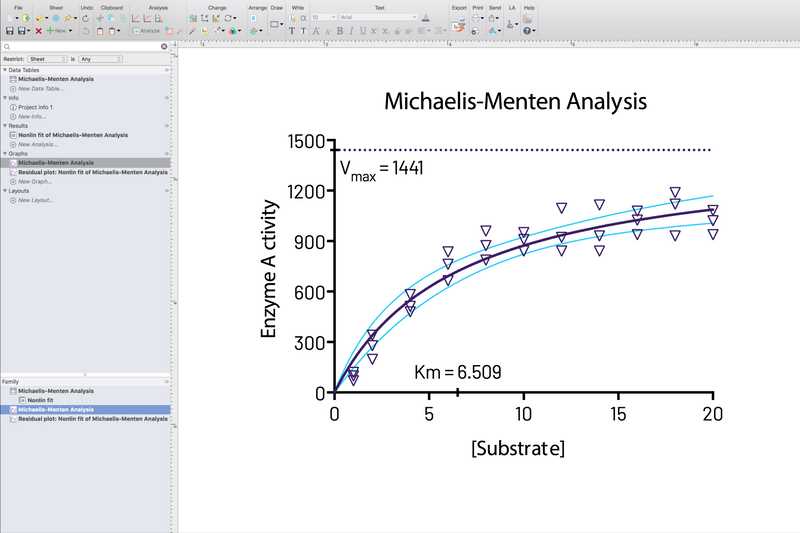
GraphPad Prism在一个综合程序中将基本生物统计学,曲线拟合和科学绘图功能强大地结合在一起。超过100个国家/地区的100,000多名科学家依靠Prism分析,绘制图形并展示其科学数据。是什么使Prism成为许多世界领先的大学,医学中心,研究机构和制药公司的首选计划?Prism当然具有您可以从一流的科学图形程序中获得的所有功能,但是,使Prism真正与众不同的不是其功能,而是其功能。专为实用科学家而设计,Prism并不希望您成为统计学家。它会指导您完成每项分析,并为您提供所需的帮助,并像其他任何程序一样跟踪和组织您的工作。您可以专注于数据,而不必与软件抗争。
graphpad-prism

分类目录

Windows版GraphPad Prism的替代品

R (programming language)

R (programming language)

R是用于统计计算和图形的免费软件环境。
Pathomx

Pathomx

Pathomx是用于分析和可视化实验数据的基于工作流的工具。
MaxStat

MaxStat

MaxStat是用于科学数据分析和制图的统计软件。
SigmaPlot

SigmaPlot

SigmaPlot is a proprietary software package for scientific graphing and data analysis for Microsoft Windows.The software can read multiple formats and perform mathematical transforms and statistical analyses.