8
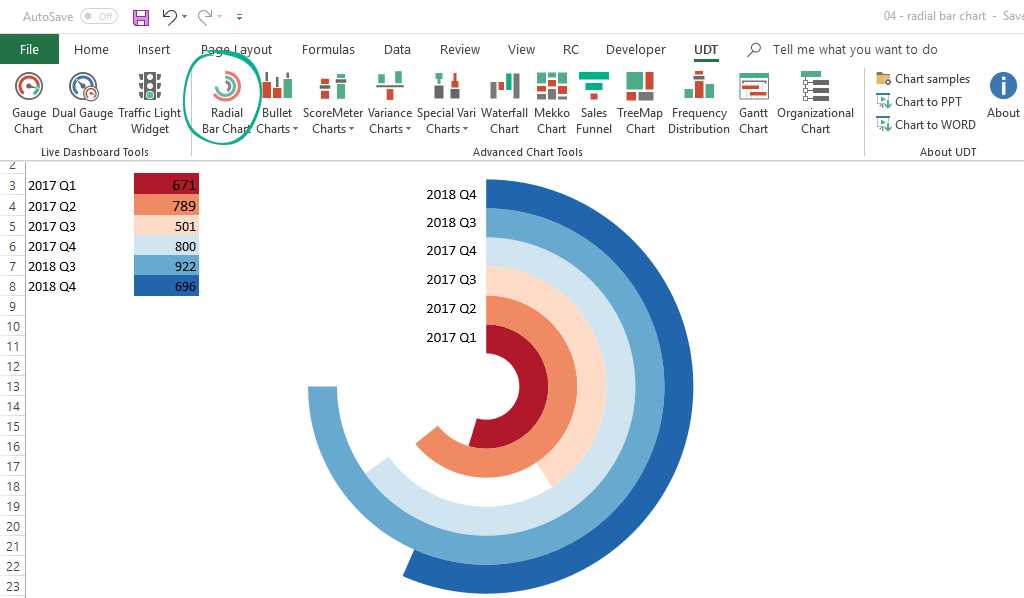
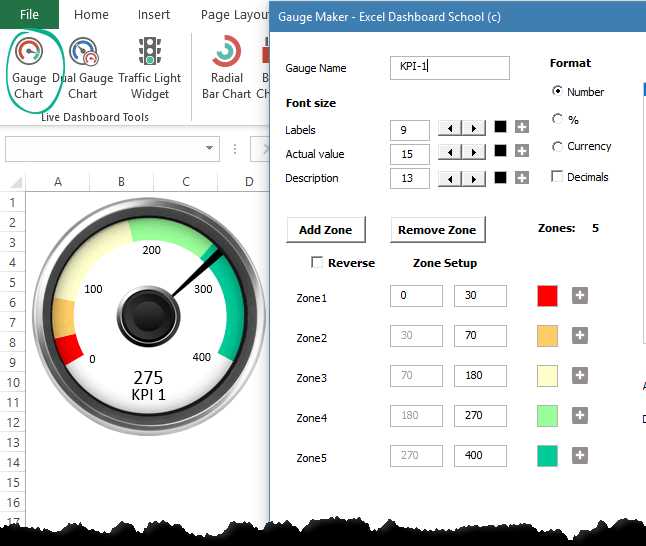
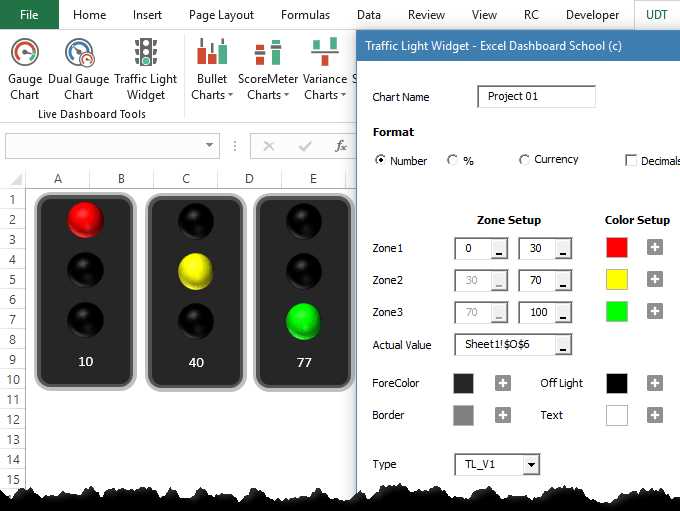
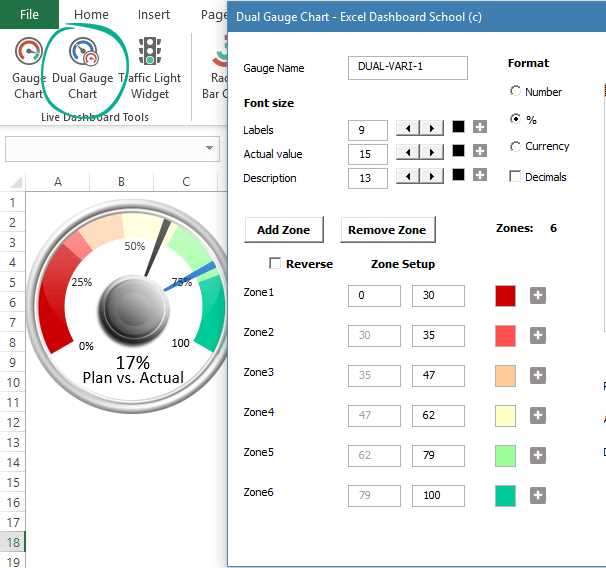
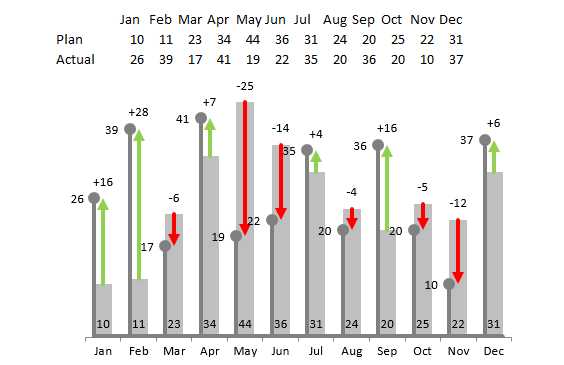
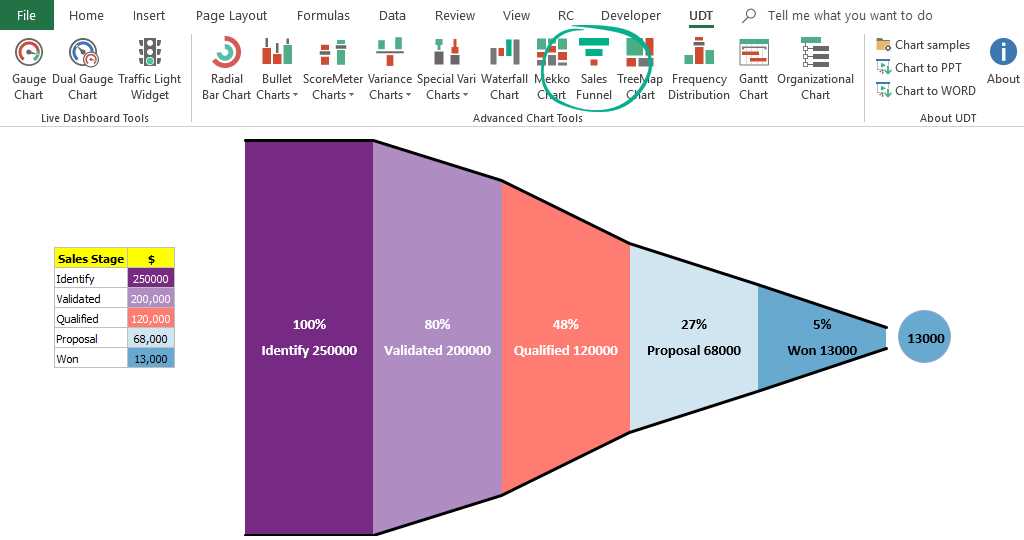
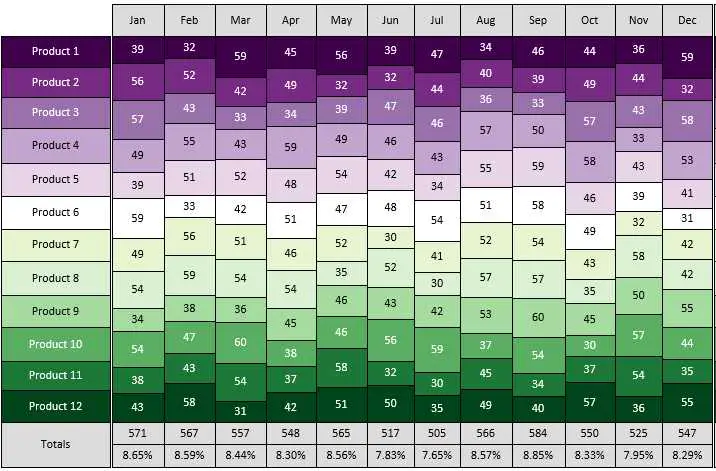
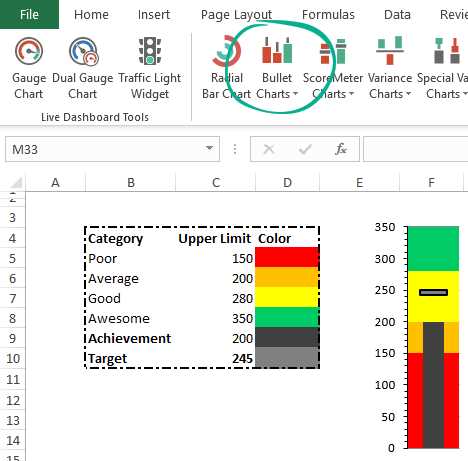
Ultimate Dashboard Tools for Excel
10合1 Excel Pro加载项,与Excel 2010、2013和2016兼容。UDT也可以在Mac Excel 2016下使用。UDT支持仪表图,子弹图,方差图,树图,瀑布图,PM工具-甘特图制作器,200多种完全可编辑的高清地图。
- 付费应用
具有商业许可证的Windows版Ultimate Dashboard Tools for Excel的替代方案
17
14
14
FusionCharts Suite XT
FusionCharts Suite XT可帮助您轻松地为所有Web,移动和企业应用程序创建交互式JavaScript图表,量表和地图。
3
Zebra BI
一键提供高级图表,例如瀑布图或方差图。使用市场上最用户友好的BI工具之一创建最佳实践报告,业务演示和BI仪表板。在Excel中工作。支持IBCS标准。
1
1
Mekko Graphics
Mekko Graphics在一个简单的程序包中提供了您所需的所有制图功能,该程序包可与Microsoft PowerPoint无缝地协同工作。
1
1
Small Business Dashboard Tools in Excel
准备使用商务人士的小型企业Excel模板。销售报告,KPI仪表板,可行性研究仪表板,库存跟踪器,价格比较仪表板等。与Excel 2007、2010、2013和2016兼容。